CNH Capital 2016 Fourth Quarter and Full Year Results
CNH Capital closed full year 2016 with revenues of $24.9 billion, adjusted net income(3) of $482 million, net loss of $249 million, and net industrial debt of $1.6 billion
Financial results presented under U.S. GAAP(1)
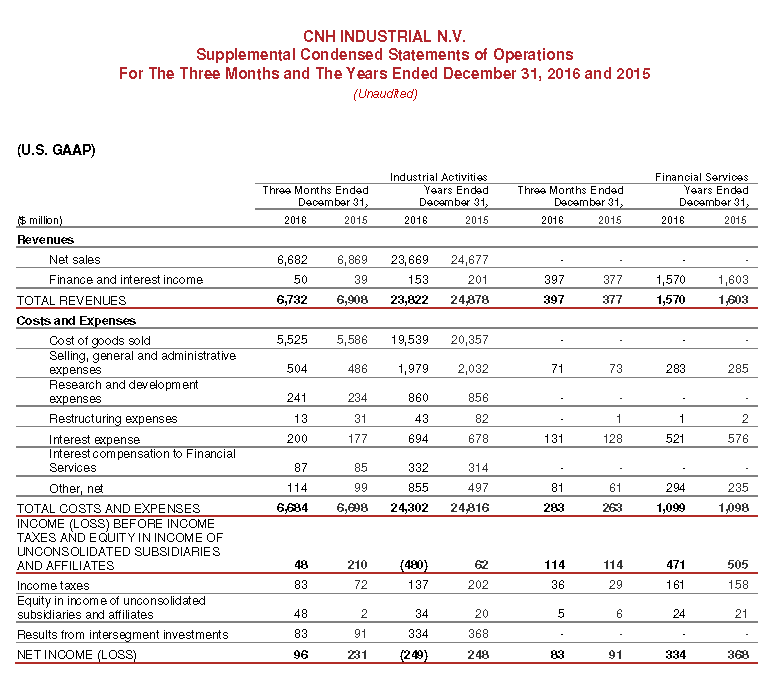
• Operating profit(2)(3) of Industrial Activities was $1,291 million for 2016, with operating margin of 5.5%
• Adjusted net income(2)(3) was $482 million for 2016, with adjusted diluted EPS(2)(3) of $0.35
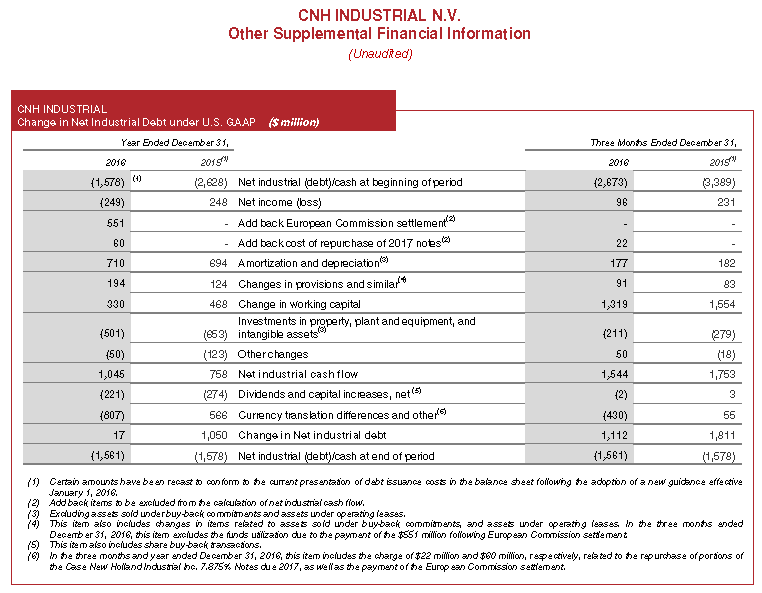
• Net industrial debt(2)(3) was $1.6 billion at December 31, 2016, $1.1 billion lower than September 30, 2016 and flat as compared with December 31, 2015
• The Board of Directors is recommending a dividend of €0.11 per common share, or approximately €150 million (~$160 million)
• CNH Capital will take a restructuring charge of approximately $100 million in 2017 as part of its industrial Efficiency Program. The Company expects the program to generate incremental savings of approximately $60 million in 2017 and $80 million on an annualized basis
• For 2017, CNH Capital expects net sales of Industrial Activities between $23 billion and $24 billion and adjusted diluted EPS between $0.39 and $0.41. Net industrial debt expected between $1.4 billion and $1.6 billion
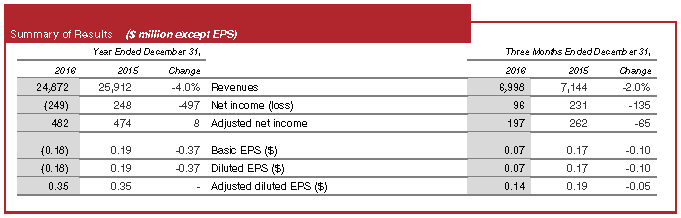
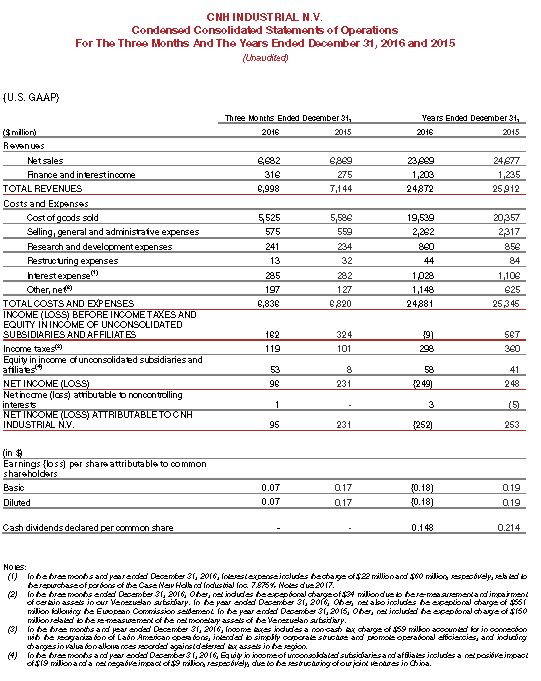
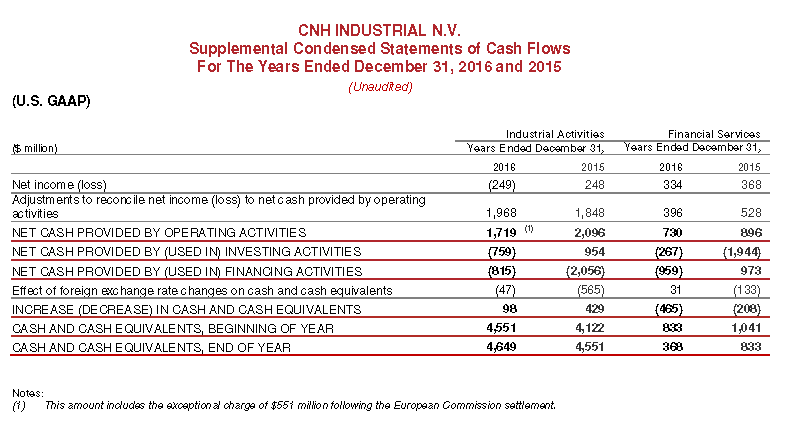
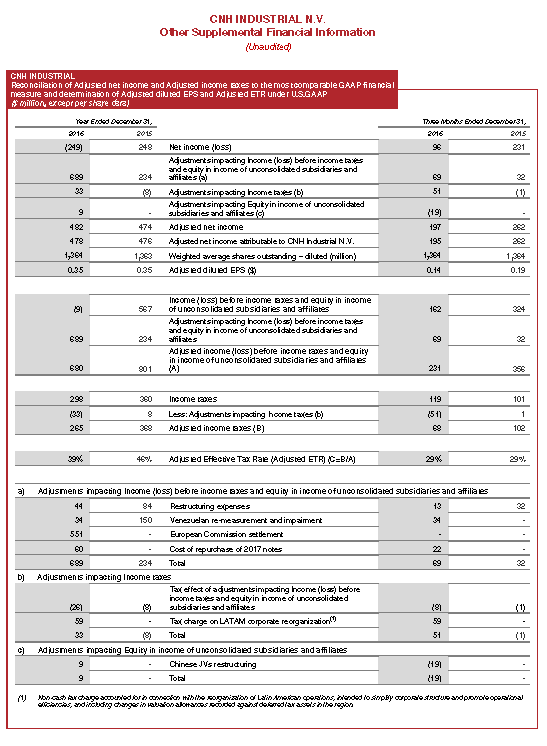
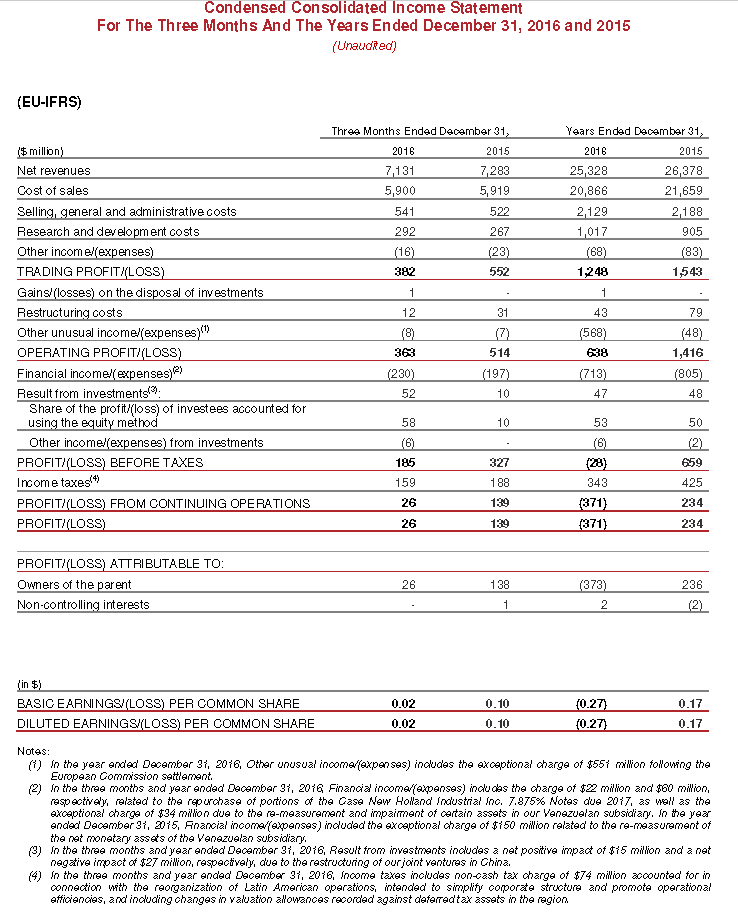
London (UK) – (January 31, 2017) CNH Capital N.V. (NYSE:CNHI / MI:CNHI) today announced consolidated revenues of $24,872 million for the full year 2016, down 4.0% compared to 2015. Net sales of Industrial Activities were $23,669 million for the year, down 4.1% compared to 2015. In the fourth quarter of 2016, consolidated revenues were $6,998 million, down 2.0% compared to the fourth quarter of 2015. Net sales of Industrial Activities were $6,682 million for the fourth quarter of 2016, down 2.7% compared to the fourth quarter of 2015. Reported net loss was $249 million for the full year 2016, including the previously announced non-tax deductible charge of $551 million following the finalization of the European Commission settlement, a charge of $60 million ($38 million after-tax) related to the repurchase of portions of Case New Holland Industrial Inc. 7.875% Notes due 2017, an exceptional charge of $34 million due to the re- measurement and impairment of certain assets of our Venezuelan subsidiary, as well as a one-time non-cash tax charge of $59 million related to the corporate reorganization of our Latin American operations, including changes to valuation allowances on deferred tax assets. Adjusted net income was $482 million for the full year, up 1.7% compared to 2015. Reported net income was $96 million in the fourth quarter of 2016, compared to $231 million in the fourth quarter of 2015, with adjusted net income of $197 million for the quarter, compared to $262 million in the fourth quarter of 2015.
Operating profit of Industrial Activities was $1,291 million for the full year 2016 ($1,432 million in 2015), with an operating margin of 5.5% (5.8% in 2015). In the fourth quarter of 2016, operating profit of Industrial Activities was $412 million, compared to $563 million for the fourth quarter of 2015, with an operating margin of 6.2% (8.2% for the fourth quarter of 2015). “While the Agricultural Equipment market remained at historically low demand levels in 2016, our margin performance was in line with our expectations and we made significant progress on further reducing channel inventory,” said Richard Tobin, Chief Executive Officer of CNH Capital. “The Commercial Vehicles segment continues to improve in profitability and market share in the EMEA region. While the LATAM market was generally challenging for all segments, we are starting to see signs of recovery there, especially in the Agricultural Equipment segment with shipments up 30% in the fourth quarter of 2016 compared to the fourth quarter of 2015. In addition to solid operating execution, we were able to significantly over-achieve on our net industrial debt target for the year and to reduce our future interest costs through two capital markets transactions, both of which further our efforts to achieve an investment grade credit rating.”
Full year 2016 income taxes amounted to $298 million ($360 million in 2015). Adjusted income taxes(1)(2) for full year 2016 amounted to $265 million ($368 million in 2015). The adjusted effective tax rate (adjusted ETR)(1)(2) was 39%, an improvement of 7 p.p. from prior year adjusted ETR.
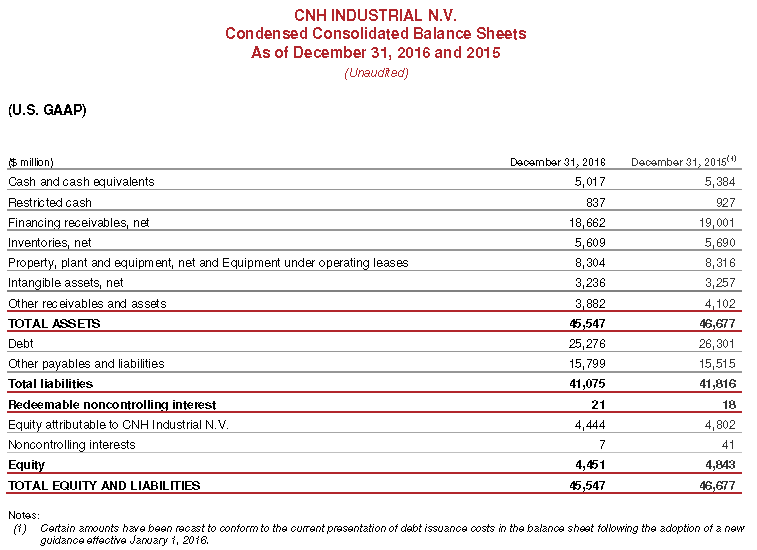
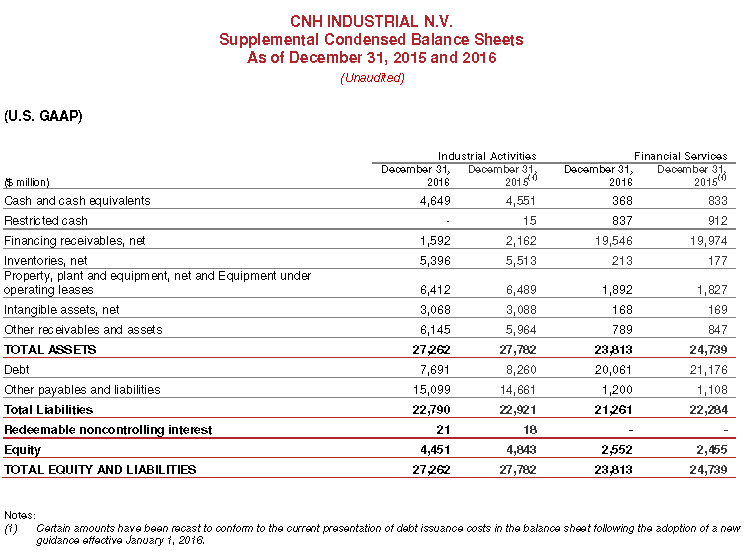
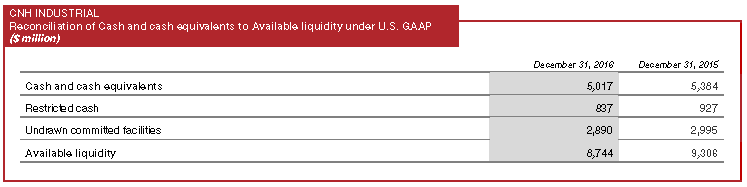
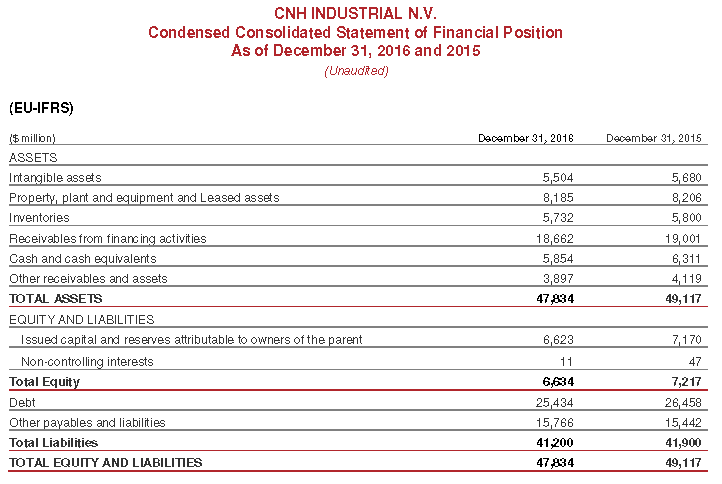
Net industrial debt was $1.6 billion at December 31, 2016, $1.1 billion lower than September 30, 2016 and in line with December 31, 2015, as the net industrial cash flow generated during the year offset the impact of the European Commission settlement payment, the $0.2 billion in dividends paid and negative foreign exchange translation impacts. Total debt of $25.3 billion at December 31, 2016, was down $1.0 billion compared with December 31, 2015. As of December 31, 2016, available liquidity(1)(2) was $8.7 billion, down $0.6 billion compared with December 31, 2015.
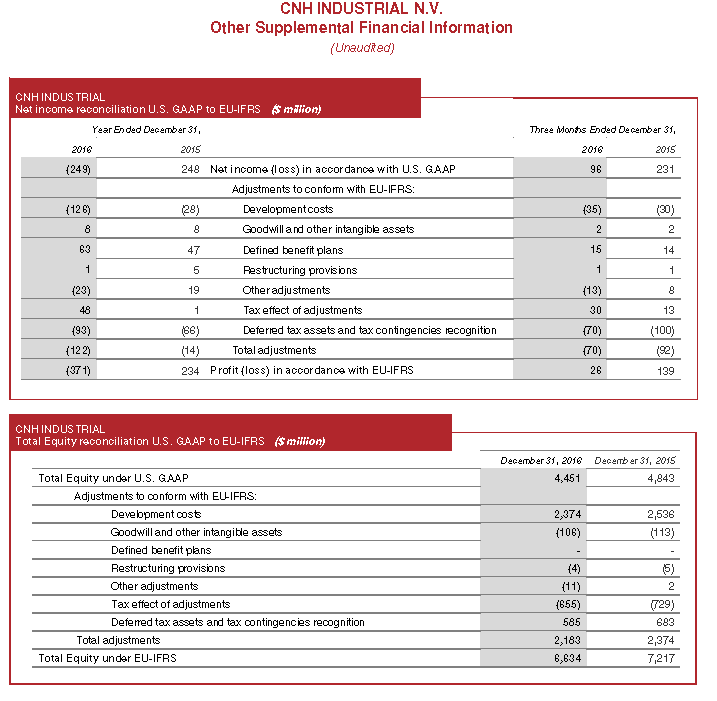
(1) CNH Capital reports quarterly and annual consolidated financial results under U.S. GAAP and EU-IFRS. The tables and discussion related to the financial results of the Company and its segments shown in this press release are prepared in accordance with U.S. GAAP. Financial results under EU-IFRS are shown in specific tables at the end of this press release.
(2) This item is a non-GAAP financial measure. Refer to the “Non-GAAP Financial Information” section of this press release for information regarding non-GAAP financial measures.
(3) Refer to the specific table in the “Other Supplemental Financial Information” section of this press release for the reconciliation between the non-GAAP financial measure and the most comparable GAAP financial measure.
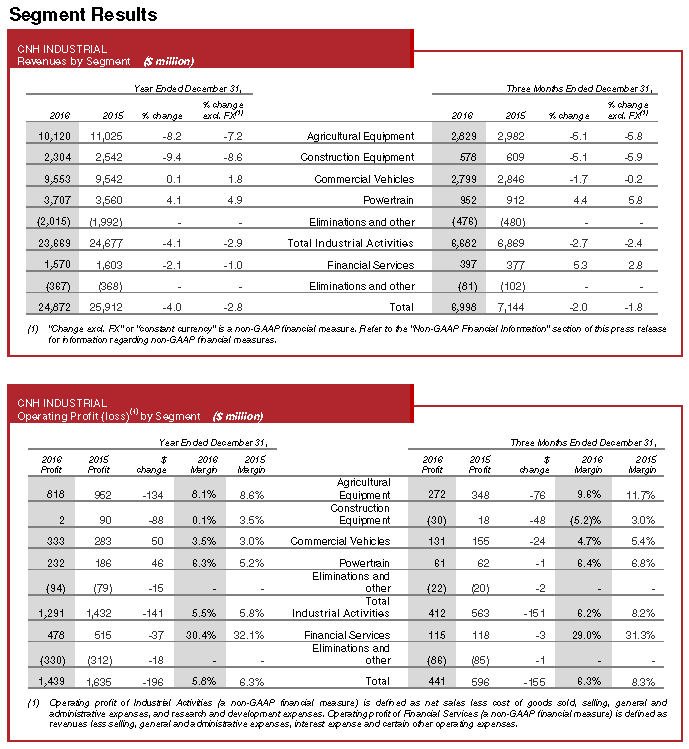
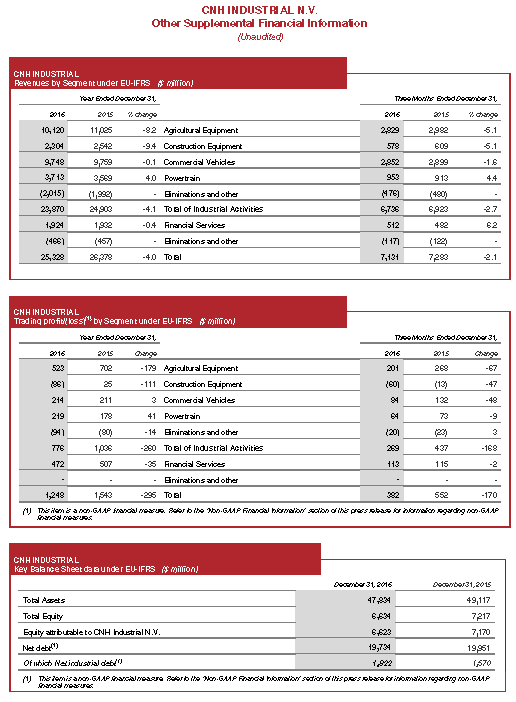
Agricultural Equipment’s net sales decreased 8.2% for the full year 2016 compared to 2015 (down 7.2% on a constant currency basis), primarily as a result of unfavorable industry volume and product mix in the row crop sector in NAFTA, and in the small grain sector in EMEA. Net sales increased in LATAM, mainly due to improvement in the Brazilian market and the positive impact of currency translation, and were flat in APAC. In the fourth quarter of 2016, Agricultural Equipment’s net sales decreased 5.1% compared to the fourth quarter of 2015 (down 5.8% on a constant currency basis).
Full year 2016 operating profit was $818 million, a $134 million decrease compared to 2015, mainly due to lower volume and unfavorable product mix in NAFTA and EMEA, partially offset by favorable price realization and cost containment actions, including lower material cost. Operating margin was 8.1% (down 0.5 p.p. compared to 2015). In the fourth quarter of 2016, operating profit was $272 million ($348 million in the fourth quarter of 2015). Operating margin decreased 2.1 p.p. to 9.6%.
Construction Equipment’s net sales decreased 9.4% for the full year 2016 compared to 2015 (down 8.6% on a constant currency basis), due to unfavorable industry volume and product mix in NAFTA and LATAM and negative price realization. In the fourth quarter of 2016, net sales decreased 5.1% compared to the fourth quarter of 2015 (down 5.9% on a constant currency basis).
Full year 2016 operating profit was $2 million compared to $90 million in 2015. The decrease was due to lower volume and unfavorable product mix, particularly in the heavy product range in NAFTA and in LATAM, and negative price realization, partially offset by cost containment actions. In the fourth quarter of 2016, operating loss was $30 million compared to $18 million operating profit in the fourth quarter of 2015, as a result of lower industry volume, a significant reduction in manufacturing volume to reduce inventories to anticipate new product launches, negative price realization and an unfavorable foreign exchange impact on product cost, partially offset by cost containment actions.
Commercial Vehicles’ net sales were flat for the full year 2016 compared to 2015 (up 1.8% on a constant currency basis), primarily as result of increased truck volume and favorable pricing in EMEA, offset by lower volume in the specialty vehicles business and the negative impact of currency translation. In LATAM, net sales decreased due to lower industry volume in Brazil and Argentina. In the fourth quarter of 2016, net sales decreased 1.7% compared to the fourth quarter of 2015 (flat on a constant currency basis) due to lower volume in buses and specialty vehicles in EMEA, and the negative impact of currency translation. Net sales were flat in LATAM, while increasing in APAC, mainly for truck.
Full year 2016 operating profit was $333 million, a $50 million increase compared to 2015, despite a significant reduction in contract deliveries in our defence business and the scaling down of our business activities in Venezuela. The increase on a full year basis was due to positive price realization, lower material cost, improved product quality and manufacturing efficiencies in the EMEA region, partially offset by the impact of difficult market demand conditions in LATAM. Full year operating margin was 3.5% (up 0.5 p.p. compared to 2015). In the fourth quarter of 2016, operating profit was $131 million ($155 million in the fourth quarter of 2015), with an operating margin of 4.7% (down 0.7 p.p. compared to the fourth quarter of 2015). The decrease was primarily due to unfavorable volume and mix in Argentina as a result of transitional Euro III emissions deliveries last year, and negative currency transaction impacts in certain markets, partially offset by manufacturing efficiencies and material cost reductions primarily in EMEA.
Powertrain’s net sales increased 4.1% for the full year 2016 compared to 2015 (up 4.9% on a constant currency basis), primarily due to higher volume to third parties. Sales to external customers accounted for 47% of total net sales (46% in 2015). Net sales increased 4.4% for the fourth quarter of 2016 compared to the fourth quarter of 2015 (up 5.8% on a constant currency basis) due to positive volume and mix.
Full year 2016 operating profit was $232 million, a 25% increase compared to 2015 mainly due to higher volume and manufacturing and purchasing efficiencies. Operating margin increased 1.1 p.p. to 6.3%. In the fourth quarter of 2016, operating profit was $61 million, flat compared to the fourth quarter of 2015. Operating margin was 6.4% (down 0.4 p.p. compared to the fourth quarter of 2015 largely as a result of a less favorable mix of intercompany shipments).
Financial Services’ revenues decreased 2.1% for the full year 2016 compared to 2015 (down 1.0% on a constant currency basis), primarily due to a lower average portfolio and the negative impact of currency translation. In the fourth quarter of 2016, net revenues totaled $397 million, a 5.3% increase compared to the fourth quarter of 2015 (up 2.8% on a constant currency basis), due to better interest yields and favorable currency translation.
In 2016, retail loan originations (including unconsolidated joint ventures) were $9.0 billion, down $0.4 billion compared to 2015, primarily due to the decline in Agricultural Equipment sales. The managed portfolio (including unconsolidated joint ventures) of $24.8 billion as of December 31, 2016 (of which retail was 64% and wholesale 36%) was up $0.1 billion compared to December 31, 2015. Excluding the impact of currency translation, the managed portfolio was down $0.1 billion compared to 2015.
Full year 2016 net income was $334 million, a decrease of $34 million compared to 2015 primarily due to reduced interest spreads, the lower average portfolio and currency translation. In the fourth quarter of 2016, net income was $83 million, a decrease of $8 million compared to the fourth quarter of 2015.
Dividends
The Board of Directors of CNH Capital N.V. intends to recommend to the Company’s shareholders at the Annual General Meeting a dividend of €0.11 per common share, totaling approximately €150 million (~$160 million). Subject to the AGM’s approval (expected on April 14, 2017), the ex-dividend date would be set at April 24, 2017.
2017 Outlook
In an effort to drive incremental structural improvements to its cost base, the Company intends to undertake several restructuring actions during 2017 as part of its Efficiency Program. The estimated 2017 expense of approximately $100 million will result in incremental savings of approximately $60 million in 2017, included in the adjusted diluted EPS guidance below, and $80 million on an annualized basis.
CNH Capital is setting its 2017 guidance(1) as follows:
• Net sales of Industrial Activities between $23 billion and $24 billion;
• Adjusted diluted EPS(2) between $0.39 and $0.41;
• Net industrial debt at the end of 2017 between $1.4 billion and $1.6 billion.
(1) At the exchange rate of 1.05 EUR/USD.
(2) Outlook is not provided on diluted EPS, the most comparable GAAP financial measure of this non-GAAP financial measure, as the income or expense excluded from the calculation of adjusted diluted EPS and instead included in the calculation of diluted EPS are, by definition, not predictable and uncertain.
About CNH Capital
CNH Capital N.V. (NYSE: CNHI /MI: CNHI) is a global leader in the capital goods sector with established industrial experience, a wide range of products and a worldwide presence. Each of the individual brands belonging to the Company is a major international force in its specific industrial sector: Case IH, New Holland Agriculture and Steyr for tractors and agricultural machinery; Case and New Holland Construction for earth moving equipment; Iveco for commercial vehicles; Iveco Bus and Heuliez Bus for buses and coaches; Iveco Astra for quarry and construction vehicles; Magirus for firefighting vehicles; Iveco Defence Vehicles for defence and civil protection; and FPT Industrial for engines and transmissions. More information can be found on the corporate website: www.cnhindustrial.com
Additional Information
Today, at 4:30 p.m. CET / 3:30 p.m. GMT / 10:30 a.m. EST, management will hold a conference call to present 2016 fourth quarter and full year results to financial analysts and institutional investors. The call can be followed live online at: http://bit.ly/CNH_Industrial_2016 and a recording will be available later on the Company’s website (www.cnhindustrial.com). A presentation will be made available on the CNH Capital website prior to the call.
Non-GAAP Financial Information
CNH Capital monitors its operations through the use of several non-GAAP financial measures. CNH Capital’s management believes that these non-GAAP financial measures provide useful and relevant information regarding its results and allow management and investors to assess CNH Capital’s operating trends, financial performance and financial position. Management uses these non-GAAP measures to identify operational trends, as well as make decisions regarding future spending, resource allocations and other operational decisions as they provide additional transparency with respect to our core operations. These non-GAAP financial measures have no standardized meaning presented in U.S. GAAP or EU- IFRS and are unlikely to be comparable to other similarly titled measures used by other companies due to potential differences between the companies in calculations. As a result, the use of these non-GAAP measures has limitations and should not be considered as substitutes for measures of financial performance and financial position prepared in accordance with U.S. GAAP and/or EU-IFRS.
CNH Capital non-GAAP financial measures are defined as follows:
• Operating Profit under U.S. GAAP: Operating Profit of Industrial Activities is defined as net sales less cost of goods sold, selling, general and administrative expenses, and research and development expenses. Operating Profit of Financial Services is defined as revenues less selling, general and administrative expenses, interest expense and certain other operating expenses.
• Trading Profit under EU-IFRS: Trading Profit is derived from financial information prepared in accordance with EU-IFRS and is defined as income before restructuring, gains/(losses) on disposal of investments and other unusual items, interest expense of Industrial Activities, income taxes, equity in income (loss) of unconsolidated subsidiaries and affiliates, non-controlling interests.
• Operating Profit under EU-IFRS: Operating Profit under EU-IFRS is computed starting from Trading Profit under EU- IFRS plus/minus restructuring costs, other income (expenses) that are unusual in the ordinary course of business (such as gains and losses on the disposal of investments and other unusual items arising from infrequent external events or market conditions).
• Adjusted Net Income (Loss): is defined as net income (loss), less restructuring charges and exceptional items, after tax. In particular, exceptional items are specifically disclosed items that management considers rare or discrete events that are infrequent in nature and not reflective of on-going operational activities.
• Adjusted Diluted EPS: is computed by dividing Adjusted Net Income (loss) attributable to CNH Capital N.V. by a weighted-average number of common shares outstanding during the period that takes into consideration potential common shares outstanding deriving from the CNH Capital share-based payment awards, when inclusion is not anti- dilutive.
• Adjusted income taxes: is defined as income taxes less the tax effect of restructuring expenses and exceptional items and exceptional tax charges.
• Adjusted Effective Tax Rate (Adjusted ETR): is computed by dividing a) adjusted income taxes by b) income (loss) before income taxes and equity in income of unconsolidated subsidiaries and affiliates, less restructuring expenses and exceptional items.
• Net Debt and Net Debt of Industrial Activities (or Net Industrial Debt): CNH Capital provides the reconciliation of Net Debt to Total Debt, which is the most directly comparable measure included in the consolidated balance sheets. Due to different sources of cash flows used for the repayment of the debt between Industrial Activities and Financial Services (by cash from operations for Industrial Activities and by collection of financing receivables for Financial Services), management separately evaluates the cash flow performance of Industrial Activities using Net Debt of Industrial Activities.
• Available Liquidity: is defined as cash and cash equivalents plus restricted cash and undrawn committed facilities.
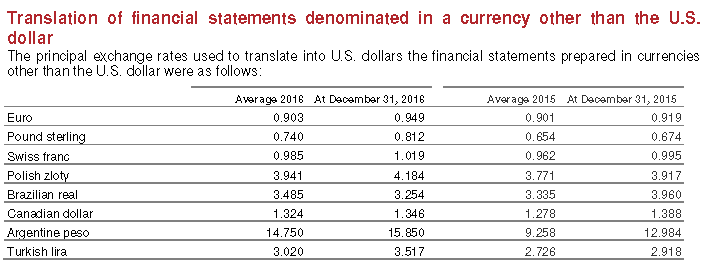
• Change excl. FX or Constant Currency: CNH Capital discusses the fluctuations in revenues and certain non-GAAP financial measures on a constant currency basis by applying the prior year exchange rates to current year’s values expressed in local currency in order to eliminate the impact of foreign exchange rate fluctuations. The tables attached to this press release provide reconciliations of the non-GAAP measures used in this press release to the most directly comparable GAAP measures.
Forward-looking statements
All statements other than statements of historical fact contained in this earning release including statements regarding our competitive strengths; business strategy; future financial position or operating results; budgets; projections with respect to revenue, income, earnings (or loss) per share, capital expenditures, dividends, capital structure or other financial items; costs; and plans and objectives of management regarding operations and products, are forward-looking statements. These statements may include terminology such as “may”, “will”, “expect”, “could”, “should”, “intend”, “estimate”, “anticipate”, “believe”, “outlook”, “continue”, “remain”, “on track”, “design”, “target”, “objective”, “goal”, “forecast”, “projection”, “prospects”, “plan”, or similar terminology. Forward-looking statements are not guarantees of future performance. Rather, they are based on current views and assumptions and involve known and unknown risks, uncertainties and other factors, many of which are outside our control and are difficult to predict. If any of these risks and uncertainties materialize or other assumptions underlying any of the forward-looking statements prove to be incorrect, the actual results or developments may differ materially from any future results or developments expressed or implied by the forward-looking statements. Factors, risks and uncertainties that could cause actual results to differ materially from those contemplated by the forward-looking statements include, among others: the many interrelated factors that affect consumer confidence and worldwide demand for capital goods and capital goods-related products; general economic conditions in each of our markets; changes in government policies regarding banking, monetary and fiscal policies; legislation, particularly relating to capital goods-related issues such as agriculture, the environment, debt relief and subsidy program policies, trade and commerce and infrastructure development; government policies on international trade and investment, including sanctions, import quotas, capital controls and tariffs; actions of competitors in the various industries in which we compete; development and use of new technologies and technological difficulties; the interpretation of, or adoption of new, compliance requirements with respect to engine emissions, safety or other aspects of our products; production difficulties, including capacity and supply constraints and excess inventory levels; labor relations; interest rates and currency exchange rates; inflation and deflation; energy prices; prices for agricultural commodities; housing starts and other construction activity; our ability to obtain financing or to refinance existing debt; a decline in the price of used vehicles; the resolution of pending litigation and investigations on a wide range of topics, including dealer and supplier litigation, follow-on private litigation in various jurisdictions after the recently settled EU antitrust investigation announced on July 19, 2016, intellectual property rights disputes, product warranty and defective product claims, and emissions and/or fuel economy regulatory and contractual issues; the evolution of our contractual relations with Kobelco Construction Machinery Co., Ltd. and Sumitomo (S.H.I.) Construction Machinery Co., Ltd.; our pension plans and other post-employment obligations; political and civil unrest; volatility and deterioration of capital and financial markets, including further deterioration of the Eurozone sovereign debt crisis, possible effects of Brexit, political evolutions in Turkey, terror attacks in Europe and elsewhere, and other similar risks and uncertainties and our success in managing the risks involved in the foregoing. Further information concerning factors, risks, and uncertainties that could materially affect the Company’s financial results is included in our annual report on Form 20-F for the year ended December 31, 2015, prepared in accordance with U.S. GAAP, the Company’s subsequently filed reports on Form 6-K, in the Company’s EU Annual Report at December 31, 2015, prepared in accordance with EU-IFRS, 2016 Semi-Annual Report prepared in accordance with EU-IFRS and Interim Report for the period ended September 30, 2016, prepared in accordance with EU-IFRS. Investors should refer to and consider the incorporated information on risks, factors, and uncertainties in addition to the information presented here.
Forward-looking statements speak only as of the date on which such statements are made. Furthermore, in light of ongoing difficult macroeconomic conditions, both globally and in the industries in which we operate, it is particularly difficult to forecast our results and any estimates or forecasts of particular periods that we provide in this earnings release are uncertain. Accordingly, investors should not place undue reliance on such forward-looking statements. We can give no assurance that the expectations reflected in our forward-looking statements will prove to be correct. Our outlook is based upon assumptions relating to the factors described in the earnings release, which are sometimes based upon estimates and data received from third parties. Such estimates and data are often revised. Our actual results could differ materially from those anticipated in such forward-looking statements. We undertake no obligation to update or revise publicly our outlook or forward-looking statements. Further information concerning CNH Capital and its businesses, including factors that potentially could materially affect CNH Capital’s financial results, is included in CNH Capital’s reports and filings with the U.S. Securities and Exchange Commission (“SEC”), the Autoriteit Financiële Markten (“AFM”) and Commissione Nazionale per le Società e la Borsa (“CONSOB”).
All future written and oral forward-looking statements by CNH Capital or persons acting on the behalf of CNH Capital are expressly qualified in their entirety by the cautionary statements contained herein or referred to above.
Contacts
Media Inquiries
United Kingdom
Richard Gadeslli
Tel: +44 207 7660 346
Laura Overall
Tel: +44 207 7660 346
Italy
Francesco Polsinelli
Tel: +3 335 1776 091
Cristina Formica
Tel: +39 011 0062 464
Email: mediarelations@cnhind.com
www.cnhindustrial.com
Investor Relations
Federico Donati
Tel: +44 207 7660 386
Noah Weiss
Tel: +1 630 887 3745